Twitter Analytics + Buffer = More Tweet Views
Ever since Twitter opened up their Analytics, I’ve probably been spending more time on it that I should admit to. It is a gold mine of information about how your tweets perform. As I was looking at the stats, I thought it would be fun to run an experiment on whether the Analytics data can tell me when to tweet.
Step 1: Gather Data
I was very interested in when was the best time to publish to be sure that most people see the tweet. What hours are best? What days of the week?
Unfortunately, Twitter Analytics gives a lot of information about particular tweets, but aggregate reports are missing. As Twitter exposes the ability to export your data into CSV, I decided to move in and hack it.
As I wanted to have everything in one place, I prepared a Chrome extension which introduces a new tab to Twitter where I could do all the hacking I need.
After loading and parsing the CSV via Papaparse and storing it in IndexedDB via PouchDB, I was ready to crunch the numbers.
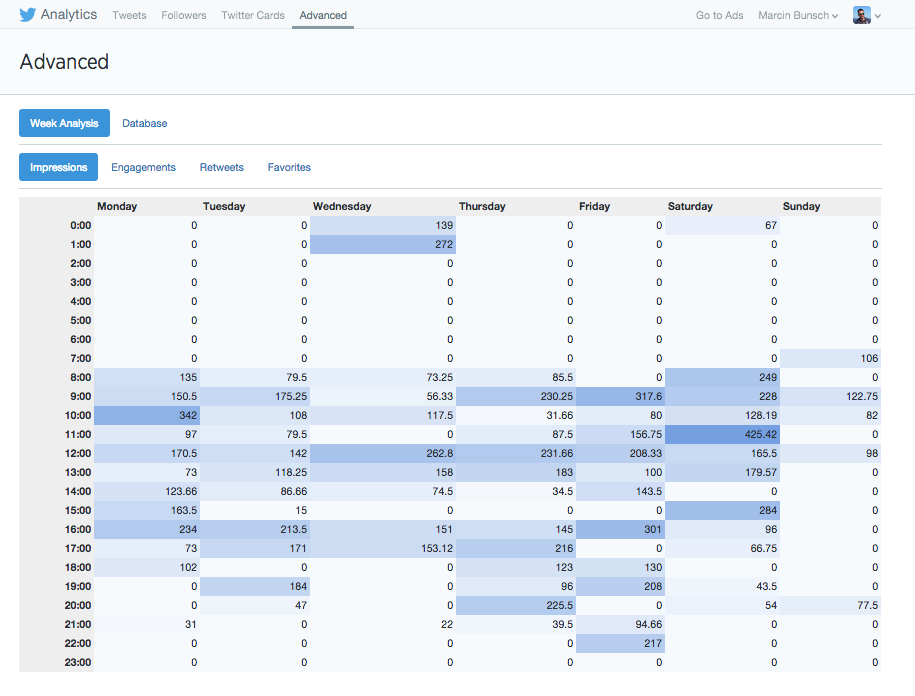
Here’s how the Week Analysis report ended up looking:

The design is lacking, but it visualizes data well. By looking at it, I concluded that I’m getting best results in the morning (9:00 AM), before lunch (11:00-12:00) and then around 4 PM.
Of course, this was error-prone:
- The hours are when I posted the Tweet. What this means is that I have an average of 150.5 on tweets I post on Mondays at 9 AM. Although not exact, it is still very useful.
- I have no historical data - Twitter starts tracking impressions when you sign up for Analytics.
I did end up with some pointers though, so it was worth to test this hypothesis.
Step 2: Prepare Strategy
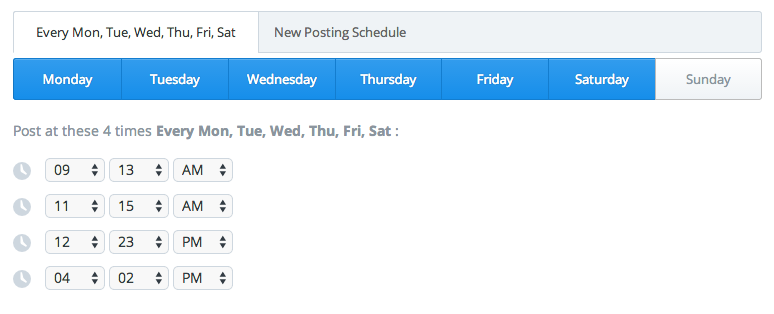
My strategy was simple: instead of posting when I feel like it, I would post at specific hours defined by the results of the Week Analysis. I wasn’t going to do it manually - in order to schedule tweets, I’ve decided to use Buffer, which is absolutely phenomenal. It allows me to specify a schedule and then drop my tweets into the buffer to be posted at the next available slot. The Chrome extension makes for simple adding from web. The iOS app is a bit wobbly, but gets the job done nicely. And the cream of the crop are suggestions, which are hand-picked. All-in-all, great choice for content management.
Here’s a screenshot of my schedule.

Step 3: Profit
I signed up for Twitter Analytics around a month ago and I’ve been running this strategy for the last 10 days. Here’s a screenshot of my Impressions timeline:

The timeframe is short, but you can already see an increase in impressions.
Conclusion
Although the experiment was about the schedule, it had effects in multiple areas which contributed to the jump of impressions
- Number of tweets - by assuming 4 slots a day + an odd tweet, it means I post at least 5 tweets a day. By sticking to the schedule, I kept close to this number.
- Content - I needed to fill the 4 slots. This was interesting - whenever I read something, I added it to Buffer. After a while, it became natural to click the Buffer Chrome extension button after finishing an article.
- Favorites and Retweets - because I increased the impressions, I’ve increased the number of favorites and retweets, which in turn boosts the signal, leading to more impressions.
All in all, I’m happy to say the experiment was a success and it proved that thinking strategically about Twitter is not limited to large brands, but has great benefits to anyone applying it.

